URL slug: 
boston
field_vji_guess_list: 
boston, cambridge

Overview

Culture

  • Values
  • Diversity, Equity, & Inclusion
  • Benefits

Do I Lead or Manage?

If leaders are supposed to lead, and managers are supposed to manage, then what do I do? The good news is that you don’t have to choose…do both. Whether you just hired your first employee or are running a 20 person team, your business needs exceptional leadership and exceptional management. Granted, being a great leader and a great manager is a lot easier said than done, but every successful business must have both. 

So what is the distinction between a leader and manager? Leadership is often associated with words such as “strategy,” “inspiration,” “vision,” “passion” and “trust.”  One willingly follows a great leader through highs and lows, knowing that he or she is working toward a vision that excites you, and that he or she will push you to greatness. A strong leader isn’t defined by where he or she sits on a company’s org chart, he or she is defined by his or her ability to influence a group of people to achieve an ambitious goal.

Management, however, is commonly seen as operations, controls and direction, implementation, attention to detail and setting objectives. Great managers will direct a group to the achievement of pre-determined goals. Success is often defined as achievement of those goals, and doing so on time and under budget. Efficiencies are celebrated and process improvements are commended. Are all of these things important? Absolutely. Are they different than leadership? They sure are.

The best bosses combine these two worlds. They have audacious goals and big dreams. They inspire with their words and their vision. But they hold themselves accountable for execution and do the same for their staff.  They have a never-ending obsession about understanding the details of the organization and know that the details make a big difference.

As we think of those who have recently led organizations to extraordinary accomplishments–Steve Jobs, Jeff Bezos and Mark Zuckerberg are just a few–we are reminded of the stories, books and movies that exalted their vision, but stressed that a critical foundation of their success was in their execution and attention to detail. A relentless pursuit of excellence is clearly a common trait amongst these leaders. It was seen while setting audacious goals that disrupted industries but the focus on excellence didn’t blur when it came to the little things. Their passion was just the same when evaluating a new product feature, interviewing a potential new team member or communicating their brand to a new market.

Success for these leaders was rooted in their ability to balance inspiration and trust with proficiency and direction. Your ability to navigate between management and leadership may be the difference between good and great for both you and your small business.

Chris McMahon is Vistaprint's Director of North America Talent Acquisition & Global Sourcing.  You can find this post, as well as additional content on Vistaprint's Micro Business Blog

SaaS Metrics 2.0 – A Guide to Measuring and Improving what Matters

“If you cannot measure it, you cannot improve it” – Lord Kelvin

This article is a comprehensive and detailed look at the key metrics that are needed to understand and optimize a SaaS business. It is a completely updated rewrite of an older post.  For this version, I have co-opted two real experts in the field: Ron Gill, (CFO, NetSuite), and Brad Coffey (VP of Strategy, HubSpot), to add expertise, color and commentary from the viewpoint of a public and private SaaS company. My sincere thanks to both of them for their time and input.

SaaS/subscription businesses are more complex than traditional businesses. Traditional business metrics totally fail to capture the key factors that drive SaaS performance. In the SaaS world, there are a few key variables that make a big difference to future results. This post is aimed at helping SaaS executives understand which variables really matter, and how to measure them and act on the results.

The goal of the article is to help you answer the following questions:

  • Is my business financially viable?
  • What is working well, and what needs to be improved?
  • What levers should management focus on to drive the business?
  • Should the CEO hit the accelerator, or the brakes?
  • What is the impact on cash and profit/loss of hitting the accelerator?

(Note: although I focus on SaaS specifically, the article is applicable to any subscription business.)

What’s so different about SaaS?

SaaS, and other recurring revenue businesses are different because the revenue for the service comes over an extended period of time (the customer lifetime). If a customer is happy with the service, they will stick around for a long time, and the profit that can be made from that customer will increase considerably. On the other hand if a customer is unhappy, they will churn quickly, and the business will likely lose money on the investment that they made to acquire that customer. This creates a fundamentally different dynamic to a traditional software business: there are now two sales that have to be accomplished:

  1. Acquiring the customer
  2. Keeping the customer (to maximize the lifetime value).

Because of the importance of customer retention, we will see a lot of focus on metrics that help us understand retention and churn. But first let’s look at metrics that help you understand if your SaaS business is financially viable.

image

The SaaS P&L / Cash Flow Trough

SaaS businesses face significant losses in the early years (and often an associated cash flow problem). This is because they have to invest heavily upfront to acquire the customer, but recover the profits from that investment over a long period of time. The faster the business decides to grow, the worse the losses become. Many investors/board members have a problem understanding this, and want to hit the brakes at precisely the moment when they should be hitting the accelerator.

In many SaaS businesses, this also translates into a cash flow problem, as they may only be able to get the customer to pay them month by month. To illustrate the problem, we built a simple Excel model which can be found here.  In that model, we are spending $6,000 to acquire the customer, and billing them at the rate of $500 per month. Take a look at these two graphs from that model:

image

image

If we experience a cash flow trough for one customer, then what will happen if we start to do really well and acquire many customers at the same time? The model shows that the P&L/cash flow trough gets deeper if we increase the growth rate for the bookings.

image

But there is light at the end of the tunnel, as eventually there is enough profit/cash from the installed base to cover the investment needed for new customers. At that point the business would turn profitable/cash flow positive – assuming you don’t decide to increase spending on sales and marketing. And, as expected, the faster the growth in customer acquisition, the better the curve looks when it becomes positive.

Ron Gill, NetSuite:

If plans go well, you may decide it is time to hit the accelerator (increasing spending on lead generation, hiring additional sales reps, adding data center capacity, etc.) in order to pick-up the pace of customer acquisition. The thing that surprises many investors and boards of directors about the SaaS model is that, even with perfect execution, an acceleration of growth will often be accompanied by a squeeze on profitability and cash flow.

As soon as the product starts to see some significant uptake, investors expect that the losses / cash drain should narrow, right? Instead, this is the perfect time to increase investment in the business. which will cause losses to deepen again. The graph below illustrates the problem:

image

Notice in the example graph that the five customer per month model ultimately yields a much steeper rate of growth, but you have to go through another deep trough to get there. It is the concept of needing to re-enter that type of trough after just having gotten the curve to turn positive that many managers and investors struggle with.

Of course this a special challenge early-on as you need to explain to investors why you’ll require additional cash to fund that next round of acceleration. But it isn’t just a startup problem. At NetSuite, even as a public company our revenue growth rate has accelerated in each of the last three years. That means that each annual plan involves a stepping-up of investment in lead generation and sales capacity that will increase spending and cash flow out for some time before it starts yielding incremental revenue and cash flow in. As long as you’re accelerating the rate of revenue growth, managing and messaging around this phenomenon is a permanent part of the landscape for any SaaS company.

Why is growth important?

We have suggested that as soon as the business has shown that it can succeed, it should invest aggressively to increase the growth rate. You might ask question: Why?

SaaS is usually a “winner-takes-all” game, and it is therefore important to grab market share as fast as possible to make sure you are the winner in your space. Provided you can tell a story that shows that eventually that growth will lead to profitability, Wall Street, acquiring companies, and venture investors all reward higher growth with higher valuations. There’s also a premium for the market leader in a particular space.

However not all investments make sense. In the next section we will look at a tool to help you ensure that your growth initiatives/investments will pay back:  Unit Economics.

A Powerful Tool: Unit Economics

Because of the losses in the early days, which get bigger the more successful the company is at acquiring customers, it is much harder for management and investors to figure out whether a SaaS business is financially viable. We need some tools to help us figure this out.

A great way to understand any business model is to answer the following simple question:

Can I make more profit from my customers than it costs me to acquire them?

This is effectively a study of the unit economics of each customer. To answer the question, we need two metrics:

  • LTV – the Lifetime Value of a typical customer
  • CAC – the Cost to Acquire a  typical Customer

(For more on how to calculate LTV and CAC, click here.)

Entrepreneurs are usually overoptimistic about how much it costs to acquire a customer. This probably comes from a belief that customers will be so excited about what they have built, that they will beat a path to their doors to buy the product. The reality is often very different! (I have written more on this topic here: Startup Killer: The Cost of Customer Acquisition, and here: How Sales Complexity impacts CAC.)

Is your SaaS business viable?

In the first version of this article, I introduced two guidelines that could be used to judge quickly whether your SaaS business is viable. The first is a good way to figure out if you will be profitable in the long run, and the second is about measuring the time to profitability (which also greatly impacts capital efficiency).

image

Over the last two years, I have had the chance to validate these guidelines with many SaaS businesses, and it turns out that these early guesses have held up well. The best SaaS businesses have a LTV to CAC ratio that is higher than 3, sometimes as high as 7 or 8. And many of the best SaaS businesses are able to recover their CAC in 5-7 months. However many healthy SaaS businesses don’t meet the guidelines in the early days, but can see how they can improve the business over time to get there.

The second guideline (Months to Recover CAC)  is all about time to profitability and cash flow. Larger businesses, such as wireless carriers and credit card companies, can afford to have a longer time to recover CAC, as they have access to tons of cheap capital. Startups, on the other hand, typically find that capital is expensive in the early days.  However even if capital is cheap, it turns out that Months to recover CAC is a very good predictor of how well a SaaS business will perform. Take a look at the graph below, which comes from the same model used earlier. It shows how the profitability is anemic if the time to recover CAC extends beyond 12 months.

I should stress that these are only guidelines, there are always situations where it makes sense to break them.

image

Three uses for the SaaS Guidelines

  1. One of the key jobs of the CEO is to decide when to hit the accelerator pedal. The value of these two guidelines is that they help you understand when you have a SaaS business that is in good shape, where it makes sense to hit the accelerator pedal. Alternatively if your business doesn’t meet the guidelines, it is a good indicator that there is more tweaking needed to fix the business before you should expand.
  2. Another way to use the two guidelines is for evaluating different lead sources. Different lead sources (e.g. Google AdWords, TV, Radio, etc.) have different costs associated with them. The guidelines help you understand if some of the more expensive lead generation options make financial sense. If they meet these guidelines, it makes sense to hit the accelerator on those sources (assuming you have the cash).Using the second guideline, and working backwards, we can tell that if we are getting paid $500 per month, we can afford to spend up to 12x that amount (i.e. $6,000) on acquiring the customer. If we’re spending less than that, you can afford to be more aggressive and spend more in marketing or sales.
  3. There is another important way to use this type of guideline: segmentation. Early-stage companies are often testing their offering with several different uses/types of customers / pricing models / industry verticals. It is very useful to examine which segments show the quickest return or highest LTV to CAC in order to understand which will be the most profitable to pursue.


Unit Economics in Action: HubSpot Example

HubSpot’s unit economics were recently published in an article in Forbes:

You can see from the second row in this table how they have dramatically improved their unit economics (LTV:CAC ratio) over the five quarters shown. The big driver for this was lowering the MRR Churn rate from 3.5% to 1.5%. This drove up the lifetime value of the customer considerably.  They were also able to drive up their AVG MRR per customer.

Brad Coffey, HubSpot:

In 2011 and early 2012 we used this chart to guide many of our business decisions at HubSpot. By breaking LTV:CAC down into its components we could examine each metric and understand what levers we could pull to drive overall improvement.

It turned out that the levers we could pull varied by segment. In the SMB market for instance we had the right sales process in place – but had an opportunity to improve LTV by improving the product to lower churn and increasing our average price in the segment. In the VSB (Very Small Business) segment, by contrast, there wasn’t as much upside left on the LTV (VSB customers have less money and naturally higher churn) so we focused on lowering CAC by removing friction from our sales process and moving more of our sales to the channel.

Two kinds of SaaS business:

There are two kinds of SaaS business:

  • Those with primarily monthly contracts, with some longer term contracts. In this business, the primary focus will be on MRR (Monthly Recurring Revenue)
  • Those with primarily annual contracts, with some contracts for multiple years. Here the primary focus is on ARR (Annual Recurring Revenue), and ACV (Annual Contract Value).

Most of the time in this article, I will refer to MRR/ACV. This means use MRR if you are the first kind of business, or ACV if you are the second kind of business. The dashboard shown below assumes monthly contracts (MRR). However in the downloadable spreadsheet, there is a tab that shows the same dashboard for the second kind, focusing on ACV instead of MRR.

SaaS Bookings: Three Contributing Elements

Every month in a SaaS business, there are three elements that contribute to how much MRR will change relative to the previous month:

What happened with new customers added in the month:

  • New MRR (or ACV)

What happened in the installed base of customers:

  • Churned MRR (or ACV) (from existing customers that cancelled their subscription. This will be a negative number.)
  • Expansion MRR (or ACV) (from existing customers who expanded their subscription)

The sum all three of these makes up your Net MRR or ACV Bookings:

image

I recommend that you track these using a chart similar to the one below:

image

This chart shows the three components of MRR (or ACV) Bookings, and the Net New MRR (or ACV) Bookings. By breaking out each component, you can track the key elements that are driving your business. The one variation we would recommend making to this chart is to show a dotted line for the plan, so you can track how you are doing against plan for each of the four lines. This is one of the most important charts to help you understand and run your business.

Ron Gill, NetSuite:

This chart is really good. I also like to look at this data in tabular form because I want to know y-o-y growth rates. E.g. “Net new MRR is up 25% over June of last year”. The Y-o-Y % is a metric easily compared with increased spending, sales capacity, etc.

The Importance of Customer Retention (Churn)

In the early days of a SaaS business, churn really doesn’t matter that much. Let’s say that you lose 3% of your customers every month. When you only have a hundred customers, losing 3 of them is not that terrible. You can easily go and find another 3 to replace them. However as your business grows in size, the problem becomes different. Imagine that you have become really big, and now have a million customers. 3% churn means that you are losing 30,000 customers every month! That turns out to be a much harder number to replace. Companies like Constant Contact have run into this problem, and it has made it very hard for them to keep up their growth rate.

Ron Gill, NetSuite:  

One oft-overlooked aspect of churn is that the churn rate, combined with the rate of new ARR adds, not only defines how fast you can grow the business, it also defines the maximum size the business can reach (see graph below).

image

It is an enlightening exercise to build a simple model like this for your business and plot where your current revenue run rate sits on the blue line defined by your present rate of ARR adds and churn. Are you near the left-hand side, where the growth is still steep and the ceiling is still far above? Or, are you further to the right where revenue growth will level off and there is limited room left to grow? How much benefit will you get from small improvements in churn or the pace of new business sign-up?

At NetSuite, we’ve had great success shifting the line in the last few years by both dramatically decreasing churn and by increasing average deal size and volume, thus increasing ARR adds. The result was both to steadily move the limit upward and to steepen the growth curve at the current ARR run rate, creating room for increasingly rapid expansion.

The Power of Negative Churn

The ultimate solution to the churn problem is to get to Negative Churn.

image

There are two ways to get this expansion revenue:

  1. Use a pricing scheme that has a variable axis, such as the number of seats used, the number of leads tracked, etc. That way, as your customers expand their usage of your product, they pay you more.
  2. Upsell/Cross-sell them to more powerful versions of your product, or additional modules.

To help illustrate the power of negative churn, take a look at the following two graphs that show how cohorts behave with 3% churn, and then with 3% negative churn. (Since this is the first time I have used the word Cohort, let me explain what it means. A cohort is simply a fancy word for a group of customers. In the SaaS world, it is used typically to describe the group that joined in a particular month. So there would be the January cohort, February cohort, etc.  In our graphs below, a different color is used for each month’s cohort, so we can see how they decline or grow, based on the churn rate.)

In the top graph, we are losing 3% of our revenue every month, and you can see that with a constant bookings rate of $6k per month, the revenue reaches $140k after 40 months, and growth is flattening out. In the bottom graph, we may be losing some customers, but the remaining customers are more than making up for that with increased revenue. With a negative churn rate of 3%, we reach $450k in revenue (more then 3x greater), and the growth in revenues is increasing, not flattening.

imageimage

For more on this topic, you may wish to refer to these two blog posts of mine:


Defining a Dashboard for a SaaS Company

The following section should be most useful for readers who are interested putting together a dashboard to help them manage their SaaS business. To this, we created an excel file for an imaginary SaaS company, and laid out a traditional numeric report on one tab, and then a dashboard of graphs on a second tab (see below). These represent one view on how to do this. You may have a very different approach. But hopefully this will give you some ideas. I would recommend adding a dotted line with the plan number to all graphs. This will allow you to quickly see how you are doing versus plan.

There are two versions of the Dashboard: the one shown below, which is designed for companies using primarily monthly contracts (focused on MRR). And a second version that can be found here which is designed for companies using annual contracts, focusing on ACV (Annual Contract Value).

image


image
image
image

image

Brad Coffey, HubSpot:

At HubSpot we obsess over these metrics – and watch many of them every day. Each night we send out a ‘waterfall’ chart that tracks our progress against our typical progress given the number of business days left in the month. Here is an example of what we look at to ensure we’re on track to meet our net MRR goals.

image

By looking at this daily we can take action immediately if we’re tracking towards a bad month or quarter. Things like services promotion (for churned MRR) or sales contests & promotions (for new & expansion MRR) are adjustments we make within a given month in order to nail our goals. (In this model we combine expansion and churned MRR into one churned MRR line).

Detailed definitions of the various metrics used

Detailed definitions for each of the various metrics used can be found in this reference document:

image

Revenue Churn vs Customer Churn – why are they different?

You might be wondering why it’s necessary to track both Customer Churn and Revenue Churn. Imagine a scenario where we have 50 small accounts paying us $100 a month, and 50 large accounts paying us $1,000 a month. In total we have 100 customers, and an MRR of $55,000 at the start of the month. Now imagine that we lose 10 of them. Our Customer churn rate is 10%. But if out of the ten churned customers, 9 of them were small accounts, and only one was a large account. We would only have lost $1,900 in MRR. That represents only 3.4% Revenue Churn. So you can see that the two numbers can be quite different. But each is important to understand if we want a complete picture of what is going on in the business.

Getting paid in advance

Getting paid in advance is really smart idea if you can do it without impacting bookings, as it can provide the cash flow that you need to cover the cash problem that we described earlier in the article. It is often worth providing good financial incentives in the form of discounts to encourage this behavior. The metric that we use to track how well your sales force is doing in this area is Months up Front.

Getting paid more upfront usually also helps lower churn. This happens because the customer has made a greater commitment to your service, and is more likely to spend the time getting it up and running. You also have more time to overcome issues that might arise with the implementation in the early days. Calculating LTV and CAC

The Metric “Months up Front” has been used at both HubSpot and NetSuite in the past as a way to incent sales people to get more paid up front when a new customer is signed. However asking for more money up front may turn off certain customers, and result in fewer new customers, so be careful how you balance these two conflicting goals.

Calculating CAC and LTV

Detailed information on how to calculate LTV and CAC is provided in the supplemental document that can be accessed by clicking here.

More on Churn: Cohort Analysis

Since churn is such a critical element for success in a SaaS company, it is an area that requires deeper exploration to understand. Cohort Analysis is one of the important techniques that we use to gain insight.

As mentioned earlier, a cohort is simply a fancy name for a group. In SaaS businesses, we use cohort analysis to observe what happens to the group of customers that joined in a particular month. So we  we will have a January cohort, a February cohort, etc. We would then be able to observe how our January cohort behaves over time (see illustration below).

image

This can help answer questions such as:

  • Are we losing most of the customers in the first couple of months?
  • Does Churn stabilize after some period of time?

Then if took some actions to try to fix churn in early months, (i.e with better product features, easier on-boarding, better training, etc.) we would want to know if those changes had been successful. The cohort analysis allows us to do this by comparing how more recent cohorts (e.g. July in the table above) compared against January. The table above shows that we made a big improvement in the first month churn going from 15% to 4%.

Two ways to run Cohort Analysis

There are two ways to run Cohort Analysis: the first looks at the number of customers, and the second looks at the Revenue. Each teaches us something different and valuable. The example graph below simply looks at the number of customers in each cohort over time:

image

The example graph below looks at how MRR evolves over time for each cohort. This particular example illustrates how the graph would look if there is very strong negative churn. As you can see, the increase in revenue from the customers that are still using the service is easily outpacing the lost revenue from churned customers. It is pretty rare to see things look this good, but it is the ideal situation that we are looking for. For those wondering if this can be achieved, one company in our portfolio, Zendesk, that has numbers that are even better than those shown in the example below.

image

In the situation above, you will need a more complex formula to calculate LTV, as the value of the average customer is increasing over time. For more on that topic, you may want to check out the accompanying definitions document.

Predicting Churn: Customer Engagement Score

Since churn is so important, wouldn’t it be useful if we could predict in advance which customers were most likely to churn? That way we could put our best customer service reps to work in an effort to save the situation. It turns out that we can do that by instrumenting our SaaS applications and tracking whether our users are engaged with the key sticky features of the product. Different features will deserve different scores. For example if you were Facebook, you might score someone who uploaded a picture as far more engaged (and therefore less likely to churn), than someone who simply logged in and viewed one page.

Similarly if you sold your SaaS product to a 100 person department, and only 10 people were using it, you would score that differently to 90 people using it. So the recommendation is that you create a Customer Engagement Score, based on allocating points for the particular features used. Allocate more points for the features you believe are most sticky. (Later on you can go back and look at the customers who actually churned, and validate that you picked the right features as a predictor of who would churn.) And separately score how many users are engaged with specific scores.

Over time you’ll also come to discover which types of use are the best indicators of possible upsell. (HubSpot was the first company that I worked with who figured this out, and they called it their CHI score. CHI stands for Customer Happiness Index. It evolved to be a very good predictor for churn.)

Brad Coffey, HubSpot:

At HubSpot we had a lot of success looking at this metric – we called in Customer Happiness Index (CHI). First – by running the analysis we identified the parts of our application that provide the most value to customers and could invest accordingly in driving adoption in those areas. Second – we used this aggregate score as an early proxy for success as we experimented with different sales and onboarding processes. If a set of customers going through an experiment had a low CHI score we could kill the project without waiting 6 or 12 months to analyze the cohort retention.

NPS – Net Promoter Score

Since it is likely that customer satisfaction is likely to be good predictor of future churn, it would be useful to survey customer satisfaction. The recommended way to measure customer happiness is to use Net Promoter Score (NPS). The beauty of NPS is that it is a standardized number, so you can compare your company to others.  For more details on Net Promoter Score, click here.

Guidelines for Churn

If your Net Revenue Churn is high (above 2% per month) it is an indicator that there is something wrong in your business. At 2% monthly churn, you are losing about 22% of your revenue every year. That is nearly a quarter of your revenue! It’s a clear indication that there is something wrong with the business. As the business gets bigger, this will become a major drag on growth.

We recommend that you work on fixing the problems that are causing this before you go on to worry about other parts of your business. Some of the possible causes of churn are:

  • You are not meeting your customers expectations.
    • The product may not provide enough value
    • Instability or bugginess
  • Your product is not sticky. It might provide some value in the first few months, and then once the customer has that value, they may feel they don’t need to keep paying. To make your product sticky, try making it a key part of their monthly workflow, and/or have them store data in your product that is highly valuable to them, where the value would be lost of they cancelled.
  • You have not successfully got the customer’s users to adopt the product. Or they may not be using certain of the key sticky features in the product.
  • Your sales force may have oversold the product, or sold it to a customer that is not well suited to get the benefits
  • You may be selling to SMB’s where a lot of them go out of business. It isn’t enough that what you’re selling is sticky. Who you’re selling it to must also be sticky.
  • You are not using a pricing scheme that helps drive expansion bookings

The best way to find out why customers are churning is to get on the phone with them and ask them. If churn is a significant part of your business, we recommend that the founders themselves make these calls. They need to hear first hand what the problem is, as this is so important for the success of the business. And they are likely to be the best people to design a fix for the problem.

The Importance of Customer Segmentation

In all SaaS businesses there will likely come a moment where they realize that not all customers are created equal. As an example, bigger customers are harder to sell to, but usually place bigger orders, and churn less frequently. We need a way to understand which of these are most profitable, and this requires us to segment the customer base into different types, and compute the unit economics metrics for each segment separately. Common segments are things size of of customer, vertical industry, etc.

Despite the added work to produce the metrics, there is high value in understanding the different segments. This tells us which parts of the business are working well, and which are not. In addition to knowing where to focus and invest resources, we may recognize the need for different marketing messages, product features. As soon as you start doing this segmented analysis, the benefits will become immediately apparent.

For each segment, we recommend tracking the following metrics:

  • ARPA (Average Revenue per Account per month)
  • Net MRR Churn rate (including MRR expansion)
  • LTV
  • CAC
  • LTV: CAC ratio
  • Months to recover CAC
  • Customer Engagement Score


Brad Coffey, HubSpot:

At HubSpot, we started to see some of our biggest improvements in unit economics when we started segmenting our business and calculating the LTV to CAC ratio for each of our personas and go to market strategies.

As one good example – when we started this analysis, we had 12 reps selling directly into the VSB market and 4 reps selling through Value Added Resellers (VARs). When we looked at the math we realized we had a LTV:CAC ratio of 1.5 selling direct, and a LTV:CAC ratio of 5 selling through the channel. The solution was obvious. Twelve months later we had flipped our approach – keeping just 2 reps selling direct and 25 reps selling through the channel. This dramatically improved our overall economics in the segment and allowed us to continue growing.

We ended making similar investments in other high LTV:CAC segments. We went so far as to incentivize our sales managers to grow their teams – but then would only place new sales hires into the segments with the best economics. This ensured we continued to invest in the best segments and aligned incentives throughout the company on our LTV:CAC goals. It also allowed us to push innovation down to the sales manager level. Managers could experiment with org structure, and sales processes – but they knew that if they didn’t hit their LTV:CAC goals they wouldn’t be able to grow their teams.

Calculating LTV:CAC by segment can be challenging, especially on the CAC side. It’s relatively easy at the top level to add up all the marketing and sales expense in a period and divide it by the total number of customers (to get CAC). Once you try to segment down your spend you run into questions like ‘how much marketing expense do I allocate to a given segment’, ‘how much of the sales expense’?

We solved this by allocating marketing expense based on number of leads and sales expense based on headcount but it’s not perfect. For us the keys are: 1) Needs to account for all costs – no free lunch, 2) It needs to be consistent over time. Progress on improving the metric is more important than the actual value.

Funnel Metrics

The metrics that matter for each sales funnel, vary from one company to the next depending on the steps involved in the funnel. However there is a common way to measure each step, and the overall funnel, regardless of your sales process. That involves measuring two things for each step:  the number of leads that went into the top of that step, and the conversion rate to the next step in the funnel (see below).

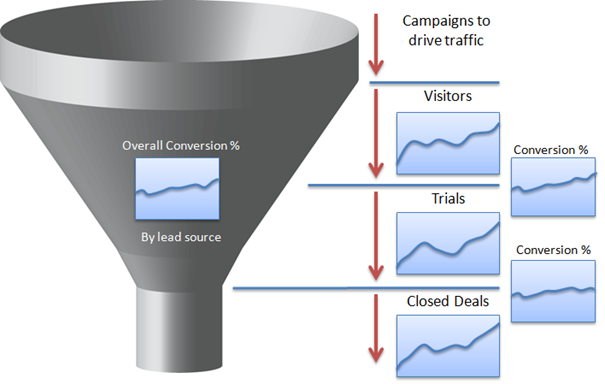
In the diagram above, (mirrored in the dashboard), we show a very simple three phase sales process, with visitors coming to a web site, and some portion of them signing up for a trial. Then some of the trials convert to purchases.  As you can see in the dashboard, we will want to track the number of visitors, trials and closed deals. Our goal should be to increase those numbers over time. And we will also want to track the conversion rates, with the goal of improving those over time.

Using Funnel Metrics in Forward Planning

Another key value of having these conversion rates is the ability to understand the implications of future forecasts. For example, lets say your company wants to do $4m in the next quarter. You can work backwards to figure out how many demos/trials that means, and given the sales productivity numbers – how many salespeople are required, and going back a stage earlier, how many leads are going to be required. These are crucial planning numbers that can change staffing levels, marketing program spend levels, etc.

Sales Capacity

In many SaaS businesses, sales reps play a key role in closing deals. In those situations, the number of productive sales people (Sales Capacity) will be a key driver of bookings. It is important to work backwards from any forecasts that are made, to ensure that there is enough sales capacity. I’ve seen many businesses miss their targets because they failed to hire enough productive salespeople early enough.

It’s also worth noting that some percentage of new sales hires won’t meet expectations, so that should be taken into consideration when setting hiring goals. Typically we have seen failure rates around 25-30% for field sales reps, but this varies by company. The failure rate is lower for inside sales reps.

When computing Sales Capacity, if a newer rep is still ramping and only expected to deliver 50% of quota, they can be counted as half of a productive rep. That is often referred to as Full Time Equivalent or FTE for short.

Another important metric to understand is the number of leads required to feed a sales rep. If you are adding sales reps, make sure you also have a clear plan of how you will drive the additional leads required.

There is much more that could be said on this topic, but since it is all very similar to managing a sales force in a traditional software company, we will leave that for other blog posts.

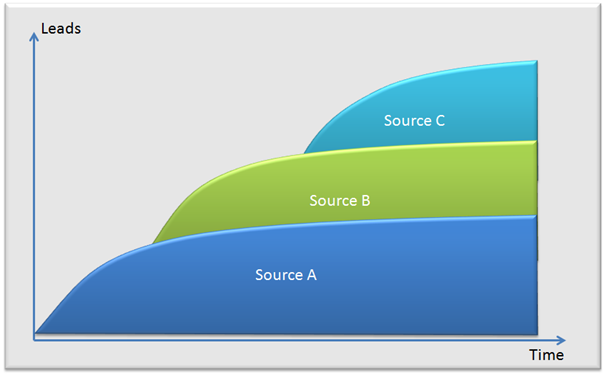
Understanding the ROI for different Lead Sources

Our experiences with SaaS startups indicate that they usually start with a couple of lead generation programs such as Pay Per Click Google Ad-words, radio ads, etc. What we have found is that each of these lead sources tends to saturate over time, and produce less leads for more dollars invested. As a result, SaaS companies will need to be constantly evaluating new lead sources that they can layer in on top of the old to keep growing.

Since the conversion rates and costs per lead vary quite considerably, it is important to also measure the overall ROI by lead source.

Growing leads fast enough to feed the front end of the funnel is one of the perennial challenges for any SaaS company, and is likely to be one of the greatest limiting factors to growth. If you are facing that situation, the most powerful advice we can give you is to start investing in Inbound Marketing techniques (see Get Found using Inbound Marketing). This will take time to ramp up, but if you can do it well, will lead to far lower lead costs, and greater scaling than other paid techniques. Additionally the typical SaaS buyer is clearly web-savvy, and therefore very likely to embrace inbound marketing content and touchless selling techniques.

What Levers are available to drive Growth

SaaS businesses are more numerically driven than most other kinds of business. Making a small tweak to a number like the churn rate can have a very big impact on the overall health of the business. Because of this we frequently see a “quant” (i.e. a numbers oriented, spreadsheet modeling, type of person) as a valuable hire in a SaaS business. At HubSpot, Brad Coffey played that role, and he was able to run the models to determine which growth plays made the most sense.

Understanding these SaaS metrics is a key step towards seeing how you can drive your business going forward. Let’s look at some of the levers that these imply as growth drivers for your business:

Churn

  • Get Churn and customer happiness right first (if this isn’t right, the business isn’t viable, so no point in driving growth elsewhere. You will simply be filling a leaky bucket.)

Product

  • You’re in a product business – first and foremost: fix your product.
    • If you’re using a free trial, focus on getting the conversion rate for that right (ideally around 15 – 20%). If this isn’t right, your value proposition isn’t resonating, or you may have a market where there is not enough pain to get people to buy.
    • Win/Loss ratio should be good
    • Trial or Sales conversion rates on qualified leads should be good

Funnel metrics

  • Increase the number of raw leads coming in to the Top of your funnel
  • Identify the profitable lead sources and invest in those as much as possible. Conversely stop investing in poor lead sources until they can be tweaked to make them profitable.
  • Increase the Conversion Rates at various stages in the funnel

Sales Metrics

  • Sales productivity (focus on getting this right consistently across a broad set of sales folks before hitting the gas)
  • Add Sales Capacity. But first make sure you know how to provide them with the right number of leads. This turns out to be one of the key levers that many companies rely on for growth. We have learned from experience how important it is to meet your targets for sales capacity by hiring on time, and hiring the right quality of sales people so there are fewer failures.
  • Increase retention for your sales people. Since you have invested a lot in making them fully productive, get the maximum return on that investment by keeping them longer.
  • Look at adding Business Development Reps. These are outbound sales folks who specialize in prospecting to a targeted list of potential buyers. For more on this topic, click here.

Pricing/Upsell/Cross Sell

  • Multi-axis pricing
  • Additional product modules (easier to sell more to existing customers than it is to sell to brand new customers)

Brad Coffey, HubSpot:

Turns out the pricing your product right can have a huge impact on the unit economics. Not simply by getting the average MRR right, or by providing upsell opportunities – but also by signaling what pieces of the product are most valuable.

At HubSpot we changed our pricing in 2011 to be tiered based on the number of contacts in the system – and actually saw an increase in adoption of the contacts application after we made the change. This is counter-intuitive but makes sense given that we sell through an inside sales team. After the pricing change, sales reps now could make a lot more money by selling the contacts. And they quickly become much better at positioning that part of the product, as well as finding companies with a contacts-based use case. Product quality will remain paramount – but it’s remarkable how much impact pricing, packaging and sales commission structure can have on product adoption and unit economics.

Customer Segmentation

Customer Segmentation analysis will help point out which are your most profitable segments. Two immediate actions that are suggested by this analysis are:

  • Double down on your most profitable segments
  • Look at your less profitable segments and consider changes that would make them more profitable: lower cost marketing & sales approaches, higher pricing, product changes, etc. If nothing seems to make sense, spend less effort on these segments.

International Markets

Expansion internationally is only recommended for fairly mature SaaS companies that already have honed their business practices in their primary market. It is far harder to experiment and tune a business in far off regions, with language and cultural differences.

Brad Coffey, HubSpot

  • One of the biggest challenges we face is the trade-off between growth and unit economics (specifically churn).  Many of the things that we have done to reduce churn have (potentially) come at the expense of lowering our growth rate. Those have been some of our hardest decisions:  e.g. requiring upfront payments, requiring customers buy consulting, holding sales reps accountable for churn, etc. We are always looking at things that give us growth without the tradeoff of lower growth. For example product improvement is an obvious one – a better product is easier to sell and provides more value to the customer. Services promotions actually work well too. Many of the options that SaaS companies have to adjust their business are not simply a win-win but are still worth exploring. Too many companies think that every problem is a product problem and every solution is that the product must get better.
  • The other thing that’s really important is that companies don’t try to spin these numbers.  There is so much pressure to dismiss a bad customer (who hurt your churn number) or exclude costs (only count marketing ‘program’ spend – not headcount).  If you can get the accounting close enough to right it actually frees management from needing to make every decision.  If the accounting is right management can obsess over setting goals (growth, LTV:CAC), hold people accountable to those goals and then give autonomy to their team on how to achieve those goals.


Plan ahead

It takes time for most initiatives to have an impact. We’ve learned from some tough lessons that planning has to be done well in advance to drive a SaaS business. For example if you are not happy with your current growth rate, it will often take nine to twelve months from the point of decision before the growth resulting from increased investment in sales and marketing will actually be observed.

The High Level Picture: How to Run a SaaS Business

Hopefully what you will have gathered from the discussion above is that there are really three things that really matter when running a SaaS business:

  1. Acquiring customers
  2. Retaining customers
  3. Monetizing your customers

The second item should be first on your list of things to get right. If you can’t keep your customers happy, and keep them using the service, there is no point in worrying acquiring more of them. You will simply be filling a leaky bucket. Rather focus your attention on plugging the leaks.

SaaS businesses are remarkably influenced by a few key numbers. Making small improvements to those numbers can dramatically improve the overall health of the business.

Once you know your SaaS business is viable using the guidelines provided for LTV:CAC, and Time to recover CAC, hit the accelerator pedal. But be prepared to raise the cash needed to fund the growth.

Although this article is long and occasionally complex, we hope that it has helped provide you with an understanding of which metrics are key, and how you can go about improving them.

Acknowledgements

I would like to thank Ron Gill, the CFO of NetSuite, and Brad Coffey & Brian Halligan of Hubspot for their help in writing this. I would like to thank the HubSpot management team without whom none of this would be possible. Most of my learnings on SaaS have come from working with them. I would also like to thank Gail Goodman, the CEO of Constant Contact who also taught us many of the key metrics in her role as board member of HubSpot.

David Skok is a General Partner with Matrix Partners.  You can find this post, as well as additional content on his blog called For Entrepreneurs.  You can also follow David on Twitter (@BostonVC) by clicking here.

Notable Entrepreneurs in Tufts History

Open Jobs Company Page

Tufts University has supposedly been fairly quiet on the startup scene - neighbored by Harvard and MIT, innovations and ventures coming from Walnut Hill in Somerville don’t tend to make the front pages. No recent undergrads have dropped out and founded multi-billion dollar tech companies, VCs don’t scour campus to eye the projects of CS students, and we don’t have entire buildings dedicated to entrepreneurial workspace (yet). But a lot of notable entrepreneurs have come out of this university, and its entrepreneurial culture goes far back.

Tufts does in fact have a healthy history of major startup successes. It was a 1988 graduate, Pierre Omidyar, who brought on the e-commerce revolution with the creation of eBay at age 28 and who remains a major investor in innovative social enterprises worldwide. SoBe, the sugary drink that fills convenience store fridges in even the smallest of towns, was founded by John Bello`68, after he transformed the NFL's merchandising arm from a mere $30mil endeavor to the multi-billion dollar behemoth it is today.

Roy Raymond, the one Jumbo mentioned in The Social Network, reimagined the shopping experience for lingerie with Victoria’s Secret, while Dov Charney got his start running a t-shirt business out of his dorm room before leaving to grow it into the American Apparel empire. If those examples sound too distant, consider another fashion company held sacred by hipsters all over - Warby Parker, whose founder Neil Blumenthal `02 saw an opportunity in the price-inflated glasses market, and launched the startup following his post-graduation job helping low-income women sell glasses at nonprofit VisionSpring. 

The Ethos-Water brand you see every day in Starbucks is the result of one student’s answer to a common question of students at Tufts: “how can I do well by doing good?” Ethos’ co-founder, Jonathan Greenblatt `92 set out to bring investments in drinkable water systems to the Third World by marketing a premium water brand in the First World, never guessing that he’d end up selling the venture to a Fortune 500 multinational and go on to run the White House Office of Social Innovation.

On the Boston tech scene, Art Papas `97 is celebrating a successful June exit for his HR software firm Bullhorn, Inc. and fellow General Catalyst-backed Tufts grad Brian Shin is leading video analytics company Visible Measures to further growth after a Series E round over the summer. Moreover, Boston-based social media powerhouse Communispace - an Inc. 500 "Fastest Growing Private Companies" member - owes its expanding market share to co-founder Diane Hessan, a Class of `75 economics major. 

Tufts University has a strong network of risk-taking alumni who jumped at the chance to build something big and innovative, and there are many recent graduates and current students who are following in their path. I would argue that Tufts is a bit of a silent giant, with top notch graduate and undergraduate programs and a go-getter spirit that leads many Jumbos to a path of entrepreneurship.

Eric Peckham is a Senior at Tufts University and a Founding Partner of the Tufts Venture Fund.  You can follow Eric on Twitter (@epeckham) by clicking here.

About the
Company

Visible Measures is the real-time video content marketing platform of choice. 

View Company Page

VentureFizz 3.0 - What's New?

We started VentureFizz over three years ago.  Our goal was to fill a void that was missing at the time.  A community website that focused on the Boston tech scene and a simple resource to keep people plugged in.  Since our launch, I have been absolutely blown away and humbled at the number of people who follow VentureFizz.

Today, I’m excited to share some exciting news about our site and our new goal, which is to be the official site of record for the tech scene in Boston.

So, what’s new with VentureFizz???

New Homepage

Although our last homepage was an improvement from the first version, it was outdated and we definitely needed a makeover to demonstrate how our site has evolved.  The new design is a much better reflection of the great content that flows onto our site daily in terms of blogs, jobs, deals, & events.

After analyzing where people spent the most time on our website, we also realized that we needed to simplify it.  Thus, we have reduced the number of tabs from our menu, so we can focus on the content that matters the most to our audience.

Expanded Blog Content

We are very proud of the blog content that flows onto VentureFizz daily.  We feature amazing content from local VCs, entrepreneurs, and subject matter experts on a wide range of topics.  All of the content is extremely useful and very meaningful for our audience. 

In June, we decided to provide more featured coverage of the Boston tech scene.  There are so many great companies and things going on in the local tech scene, yet only a few of these stories are being told.  These stories need to be heard and we want to do our part to increase the buzz factor.

One of our journalists, Susan Johnston, has been doing an amazing job at covering some of these stories with companies like Care.com, Cloze, Bandwagon, Jana, etc., etc. 

Previously, we would feature one blog post a day on VentureFizz, but that is going to change.  Our new homepage design allows us to increase the volume of quality blog content daily.  We will be able to also publish stories much faster, which is another important part of creating a buzz factor.

Job Board

The VentureFizz Job Board is the top resource for companies both large and small to find great talent in the Boston area.  Our Job Board went through a redesign a few months ago and what was already a great resource... only got better.  For example, I was at WebInno last Monday and I was checking out Handybook’s demo as one of the side dishes…only to learn that one of the team members found their job through VentureFizz – awesome!!!

Deals / Calendar

Our Deals section covers all the daily funding, M&A, and IPO activity.  This section of our website has been growing in popularity and it is only getting better.

VentureFizz had the first comprehensive calendar of all the networking events in the area and it is still going strong.  It has definitely become a key resource for people to plan out their week and get out there to shake some hands.

The Future

As we mentioned before, the new homepage design and the other changes to the site allow us to increases the amount of content that we will be publishing, so we hope that you visit VentureFizz daily. 

Although analytics and traffic reports are interesting, our first and foremost mission is to provide high quality content to our audience and that commitment will never be compromised.

Also – please help us get the news out there by sharing VentureFizz across your networks!!!  Click here for a pre-written Tweet.

Thank you for your continued support!  We appreciate it!  More to come…

The History of Android

Back in 2003, Android was a startup that was on a mission to build something innovative... with an original business model for building a platform for carriers... that ultimately made a major pivot based on meetings with Google, who subsequently acquired Android in 2005.  Today, Android is the mobile operating system for over 100 million gadgets.

I stumbled upon this great video of Rich Miner discussing the history of Android at a Mobile Monday Boston meeting last August.  Rich is one of the co-founders of Android and he is now a Partner with Google Ventures in Cambridge.

This is a great video for entrepreneurs to watch.  One of the important lesson that he talks about is... "be at the right place, at the right time."  Meaning... they spent their time building technology in a market that was ripe for disruption because:  A. Technology had advanced to the point where it made building Android feasible (CPU power, memory, touch screens, battery life) & B. The major players (except Apple) were dropping the ball.

Below is the video - enjoy!

Published:  June 20, 2011

LinkedIn: The Series A Fundraising Story

LinkedIn went public last week.  As a shareholder I'm obviously pleased with the investor reception LinkedIn has received, but more importantly it's a great milestone for the company we started nearly 9 years ago.

A lot of people ask me what it was like raising the Series A round for LinkedIn back in 2003.  Many assume it was a cakewalk, based on the success LinkedIn has enjoyed over time and the current stature of our founder/CEO Reid Hoffman (now Chairman).  We ultimately had a good outcome with our Series A but I assure you it required some hard work and we faced plenty of skepticism.  I thought I'd revisit it and share the story...

First, you have to rewind mentally to early 2003.  Google is still a private company (their IPO was Aug 2004).  Yahoo! is the leading consumer internet company with Terry Semel as CEO.  Silicon Valley is still emerging from the tech bubble and massive downturn of late 2000-2002.  The market size for online advertising, e-commerce, and web premium services are 1/10th to 1/3rd the size they are today.  To give you a sense, for 2002 the entire US online ad market was $6B and had shrunk year over year (it was $25B+ for 2010). Salesforce.com is a startup with 76,000 subscribers (over 2.1M today).  Apple is gearing up to launch a revolutionary iPod with a touch sensitive wheel instead of a mechanically rotating one, and the thought of them entering the cell phone business is mildly preposterous.  

Online social networking is a concept still being evangelized even in Silicon Valley... Friendster is in private beta (wasn't until Oct 2003 they received Google acquisition offer which they turned down for Kleiner/Benchmark round). Facebook doesn't exist, even as a walled-garden college social network (Mark Zuckerberg was part way through his freshman year at Harvard).  There are no social platforms to build on top of... if a social graph is important to what you're doing, you better create one from scratch.  It'll be nearly two years before the concept of "Web 2.0" is popularized by Tim O'Reilly (the first Web 2.0 conference happened at the end of 2004).

I also joke with Reid Hoffman that this was back in the days before he was "Reid".  Reid's an incredible entrepreneur, startup investor, and human being.  It's truly a privilege to have known him for more than a decade as my mentor, boss, and friend going back to the early PayPal days.  But keep in mind at this point Reid's a first-time CEO.  Yes... he was a very successful PayPal exec and previously co-founder & VP Product of SocialNet.  The latter was backed by Accel in late 90s, but in many ways it was too early for its time and ultimately wasn't a success.  Reid's investing activities are just beginning, i.e. he was an angel in Friendster and one or two other companies at this point but this is long before Facebook, Zynga, etc.  If Reid were to start a company today he'd probably have every VC in America offering to back him, but this wasn't necessarily the case when we started LinkedIn out of his apartment in Mountain View at the end of 2002.

Ok, now you have the context for early 2003.  Reid assembled the founding team drawing largely from his prior startups, with a few other folks he'd known for a long time.  He provided our initial seed funding to launch the website publicly on May 5, 2003.  Not long after the product launch we began the initial conversations with VCs for a Series A round.  

Reid & I ran around Sand Hill Road for the next several months meeting with literally dozens of firms. Many of these firms you'd recognize well, though a few you might not and a couple we pitched are essentially out of the VC business today.  Some groups were intimately familiar with the PayPal story and others were only casual observers.  

In total I think we spoke with at least 25 firms of various types.  We pitched the full partnership of 6 firms that I can recall, though it's possible I'm missing somebody.  It was an interesting mix of reactions... a couple quickly grasped the opportunity we were pursuing and liked our team and concept.  One partnership was clearly very divided and a vocal minority of GPs thought consumer internet companies were a massive waste of time and money.  In another we decended into a debate about our 5 year forecasts (I built the models so fielded most of these questions), and it became clear they probably weren't the best fit for our Series A round (this group is no longer in the early-stage VC business).  And a third firm "pressure tested" (i.e. grilled) Reid to see if he still had entrepreneurial zeal, after already having some success at PayPal.  That one didn't end terribly well.

I certainly bear no ill will to the various firms that ultimately passed on our fundraise... as a seed stage VC myself now I can appreciate how hard it is evaluating companies at the earliest stages of development.  Lots of VCs had been burned in the bubble and enthusiasm about consumer internet companies was very much a contrarian view at the time.  LinkedIn's product had only been live for a couple months, we only had tens of thousands of registered users, and wouldn't start generating revenue for more than a year after this point.  But I can similarly appreciate the enthusaism of the small handful of firms that did express interest in our round.  As I'm fond of saying, startup fundraising isn't about convincing skeptics but rather finding true believers.

At the end of the process, which ran into the fall of 2003, we received term sheets from two firms and had a third which expressed interest in participating though not leading the round.  The terms and valuation for both offers were comparable and when the team debated which path to choose, we all agreed both firms would have made good partners.  For a variety of reasons we ultimately chose Sequoia Capital's term sheet, ironically they first showed interest pretty late in the deal process but to their credit moved quickly from there.  It was a $4.7M round which closed in November 2003, and the pre-money valuation between $10 million and $15 million.  So from start to finish our fundraise took roughly four to five months.

The rest, as they say, is history.  Or more accurately many years of hard work and innovation by a lot of great folks.

Lee Hower is a Partner & Co-Founder with NextView Ventures.  You can find this blog post, as well as additional content on his blog called AgileVC.  You can also follow Lee (@leehower) on Twitter by clicking here.

SaaS Metrics – A Guide to Measuring and Improving What Matters

This blog post looks at the high level goals of a SaaS business and drills down layer by layer to expose the key metrics that will help drive success. Metrics for metric’s sake are not very useful. Instead the goal is to provide a detailed look at what management must focus on to drive a successful SaaS business. For each metric, we will also look at what is actionable.

Before going any further, I would like to thank the management team at HubSpot, and Gail Goodman of Constant Contact, who sits on the HubSpot board. A huge part of the material that I write about below comes my experiences working with them. In particular HubSpot’s management team is comprised of a group of very bright individuals that are all very metrics driven, and they have been clear thought leaders in developing the appropriate tools to drive their business. I’d also like to thank John Clancy, who until recently was President of Iron Mountain Digital, a $230m SaaS business, and Alastair Mitchell, CEO and founder of Huddle.

Let’s start by looking at the high level goals, and then drill down from there:


image

Key SaaS Goals


  • Profitability: needs no further explanation.
    • MRR Monthly Recurring Revenue: In a SaaS business, one of the most important numbers to watch is MRR. It is likely a key contributor to Profitability.

  • Cash: very critical to watch in a SaaS business, as there can be a high upfront cash outlay to acquire a customer, while the cash payments from the customer come in small increments over a long period of time. This problem can be somewhat alleviated by using longer term contracts with advance payments.
    • Months to recover CAC: one of the best ways to look at the capital efficiency of your SaaS business is to look at how many months of revenue from a customer are required to recover your cost of acquiring that customer(CAC). In businesses such as banking and wireless carriers, where capital is cheap and abundant, they can afford a long payback period before they recover their investment to acquire a customer (typically greater than one year). In the startup world where capital is scarce and expensive, you will need to do better. My own rule says that startups need to recover their cost of customer acquisition in less than 12 months.
      (Note: there are other web sites and blogs that talk about the CAC ratio, with a complex formula to calculate it. This is effectively a more complicated way of saying the same thing. However I have found that most people cannot relate well to the notion of a CAC ratio, but they can easily relate to the idea of how many months of revenue it will take to recover their investment to acquire a customer. Hence my preference for the term Months to Recover CAC.)

  • Growth: usually a critical success factor to gaining market leadership. There is clear evidence that once one company starts to emerge as a market leader, there is a cycle of positive reinforcement, as customers prefer to buy from the market leader, and the market leader gets the most discussion in the press, blogosphere, and social media.


Two Key Guidelines for SaaS startups


image

The above guidelines are not hard and fast rules. They are what I have observed to be needed by looking at a wide variety of SaaS startups. As a business moves past the startup stage, these guidelines may be relaxed.

In the next sections, we will drill down on the high level SaaS Goals to get to the components that drive each of these.


Three ways to look at Profitability


image

  1. Micro-Economics (per customer profitability): Micro-economics is the term used to describe looking at the economics of your business on a single customer level. Most business models (with a few exceptions such as marketplaces) are based around a simple principle: acquire customers and then monetize them. Micro-economics is about measuring the numbers behind these two essential ingredients of a customer interaction. The goal is to make sure the fundamental underpinnings of your business are sound: how much it cost to acquire your customers, and how much you can monetize them. i.e. CAC and LTV (cost of acquiring a customer, and lifetime value of the customer). In a SaaS business, you have a great business if LTV is significantly greater than CAC. My rule of thumb is that LTV must be at least 3x greater than CAC. (As mentioned elsewhere in this blog, your startup will die if your long term number for CAC is higher than your LTV. See Startup Killer: The cost of acquiring customers.)
  2. Overall profitability (standard accounting method): This looks a the standard accounting way of deriving profitability: revenue – COGS – Expenses.  The diagram also notes that Revenue is made up of MRR + Services Revenue. Since MRR is such a critical element, there will be a deeper drill down to understand the key component drivers.
  3. Profitability per Employee: it can be useful to look at the factors contributing to profitability on a per employee basis, and benchmark your company against the rest of the industry. Expenses per Employee is usually around $180-200k annually for businesses with all their employees in the US. (To calculate the number take the total of all expenses, not just salaraies, and divide by the number of employees.) Clearly to be profitable in the long term, you will want to see revenue per employee climb to be higher than expenses, taking into account your gross margin %.


Drill down on MRR

image

MRR is computed by multiplying the total number of paying customers by the average amount that they pay you each month (ARPU).

  • Total Customers:  a key metric for any SaaS company. This increases with new additions coming out the bottom of the sales funnel, and decreases by the number of customers that churn. Both of these are key metrics, and we will drill down into them later.
  • ARPU – average monthly revenue per customer: (The term ARPU comes from the wireless carriers where U stands for user.)  This is another extremely imporant variable that can be tweaked in the SaaS model. If you read my blog post on the JBoss story, you will see that one of the key ways that we grew that business was to take the average annual deal size from $10k, to $50k.  Given that the other parts of the pipeline worked with the same numbers and conversion rates, this grew the business by 5x.  We will drill down into how you can do the same thing a little further on.


Drill down on Micro-Economics (Per Customer Profitability)

Our goal is to see a graph that looks like the following:

image

To achieve this, lets look at the component parts of each line, to see what variables we can use to drive the curves:


image

As mentioned earlier, customer profitability = LTV – CAC.

Drill down on LTV

Drilling down into the factors affecting LTV, we see the following:

LTV = ARPU x Average Lifetime of a Customer – the Cost to Serve them (COGS)

It turns out that the Average Lifetime of a Customer is computed by 1/Churn Rate. As an example, if a you have a 50% churn rate, your average customer lifetime will be 1 divided by 50%, or 2 months. In most companies that I work with, they ignore tracking the average lifetime, but instead track the monthly churn rate religiously.

The importance of a low churn rate cannot be overstated. If your churn rate is high, then it is a clear indication of a problem with customer satisfaction. We will drill down later into how you can measure the factors contributing to Churn Rate, and talk about how you can improve them.

Drill down on CAC

The formula to compute CAC is:

CAC = Total cost of Sales & Marketing  /  No of Deals closed

It turns out that we are actually interested in two CAC numbers. One that looks purely at marketing program costs, and one that also takes into consideration the people and other expenses associated with running the sales and marketing organization. The first of these gives us an idea of how well we could do if we have a low touch, or touchless sales model, where the human costs won’t rise dramatically over time as we grow the lead flow.  The second number is more important for sales models that require more human touch to close the deal. In those situations the human costs will contribute greatly to CAC, and need to be taken into consideration to understand the true micro-economics.

I am often asked when it is possible to start measuring this and get a realistic number. Clearly there is no point in measuring this in the very early days of a startup, when you are still trying to refine product/market fit. However as you get to the point of having a repeatable sales model, this number becomes important, as that is the time when you will usually want to hit the accelerator pedal. It would be wrong to hit the accelerator pedal on a business that has unprofitable micro-economics. (When you are computing the costs for a very young company, it would be fair to remove the costs for people like the VP of Sales and VP of Marketing, as you will not hire more of these as you scale the company.)

When we look at how to lower CAC, there are a number of important variables that can be tweaked:

  • Sales Funnel Conversion rates: a funnel that takes the same number of leads and converts them at twice the rate, will not only result in 2x more closed customers, but will also lower CAC by half.  This is a very important place to focus energy, and a large part of this web site is dedicated to talking about how to do that. We will drill down into the Sales Funnel conversion rates next.
  • Marketing Program Costs: driving leads into the top of your sales funnel will usually involve a number of marketing programs. These could vary from pay per click advertising, to email campaigns, radio ads, tradeshows, etc. We will drill down into how to measure and control these costs later.
  • Level of Touch Required: a key factor that affects CAC is the amount of human sales touch required to convert a lead into a sale. Businesses that have a touchless conversion have spectacular economics: you can scale the number of leads being poured into the top of the funnel, and not worry about growing a sales organization, and the associated costs. Sadly most SaaS companies that I work with don’t have a touchless conversion. However it is a valuable goal to consider. What can you do to simplify both your product and your sales process to lower the amount of touch involved? This topic is covered at the bottom of a prior blog post:  Startup Killer: the cost of acquiring customers.
  • Personnel costs: this is directly related to the level of touch required. To see if you are improving both of these, you may find it useful to measure your Personnel costs as a % of CAC over time.


Drill down on Sales Funnel Conversion Rates

The metrics that matter for each sales funnel, vary from one company to the next depending on the steps involved in the funnel. However there is a common way to measure each step, and the overall funnel, regardless of your sales process. That involves measuring two things for each step:  the number of leads that went into the top of that step, and the conversion rate to the next step in the funnel (see below).


image


You will also want to measure the overall funnel effectiveness by measuring the number of leads that go into the top of the funnel, and the conversion rate for the entire funnel process to signed customers.

The funnel diagram above shows a very simple process for a SaaS company with a touchless conversion. If you have a conversion process involving a sales organization, you will want to add those steps to the funnel process to get insights into the performance of your sales organization. For example, your inside sales process might look like the following:


image


Here if we look at the closed deals and overall conversion rates by sales rep, we will have a good idea of who our best reps are. For lower performing reps, it is useful to look at the intermediate conversion rates, as someone that is doing a poor job of, say, converting demos to closed deals could be an indication that they need demo training from people that have high conversion rates for demos. (Or, as Mark Roberge, VP of Sales at HubSpot, pointed out, it could also mean that they did a poor job of qualifying people that they put into the Demo stage.)

These metrics give you the insight you need into your sales and marketing machine, and those insights give you a roadmap for what actions you need to take to improve conversion rates.

Using Funnel Metrics in forward planning

Another key value of having these conversion rates is the ability to understand the implications of future forecasts. For example, lets say your company wants to do $4m in the next quarter. You can work backwards to figure out how many demos/trials that means, and given the sales productivity numbers – how many salespeople are required, and going back a stage earlier, how many leads are going to be required. These are crucial planning numbers that can change staffing levels, marketing program spend levels, etc.

Drill down by Customer Type

If you have different customer types, you will want to look at all the CAC and LTV metrics for each different customer type, to understand the profitability by customer type. Often times this can lead you to a decision to focus more energy on the most profitable customer type.

Drill down into ROI per Marketing Program

My experiences with SaaS startups indicate that they usually start with a couple of lead generation programs such as Pay Per Click Google Ad-words, radio ads, etc. What I have found is that each of these lead sources tends to saturate over time, and produce less leads for more dollars invested. As a result, SaaS companies will need to be constantly evaluating new lead sources that they can layer in on top of the old to keep growing.

image 

Since the conversion rates and costs per lead vary quite considerably, it is important to also measure the overall ROI by lead source:


image


Growing leads fast enough to feed the front end of the funnel is one of the perennial challenges for any SaaS company, and is likely to be one of the greatest limiting factors to growth. If you are facing that situation, the most powerful advice I can give you is to start investing in Inbound Marketing techniques (see Get Found using Inbound Marketing). This will take time to ramp up, but if you can do it well, will lead to far lower lead costs, and greater scaling than other paid techniques. Additionally the typical SaaS buyer is clearly web-savvy, and therefore very likely to embrace inbound marketing content and touchless selling techniques.

From Alistair Mitchell, CEO of Huddle: “Just calculating CAC can be extremely complicated, given the numerous ways in which people find out about your service.  To stop getting too bogged down in the detail, its best to start with a blended rate that just takes your total spend on marketing (people, pr, acquisition etc) and split this across all your customers, regardless of type or source. Then, once you’ve got comfortable with that, you can start to break CAC down by the different customer types and elements of your inbound funnel, and start measuring specific campaigns for their contribution to each customer type.”

Drill down into Churn Rate

image

As described in the section on LTV, Churn Rate has a direct effect on LTV. If you can halve your churn rate, it will double your LTV. It is an enormously important variable in a SaaS business. Churn can usually be attributed to low customer satisfaction. We can measure customer satisfaction using customer surveys, and in particular, the Net Promoter Score.

If you are using longer term contracts, another key metric to focus on is renewals. From John Clancy, ex-President of Iron Mountain Digital: “

Non-renewals add to churn, but they can have different drivers. We spent a lot of time examining our renewal rates and found that a single digit improvement made a huge difference. Often times the driver on a non-renewal is economic – the internal IT department has mounted a campaign to bring the solution back in house. SaaS businesses need to identify renewal dates and treat the renewal as a sales cycle (it’s much easier and less expensive than a new sale, but it deserves the same level of attention) Many SaaS businesses make the mistake of taking renewals for granted.”

A good predictor of when a customer is about to churn is their product usage pattern. Low levels of usage indicate a lack of commitment to the product. It can be a good idea to instrument the product to measure this, looking for particular features our usage patterns that are correlated with stickiness, or a likelihood to churn.

Another measurement tool that can be very useful in understanding churn is to look at a Cohort Analysis. The term cohort refers to a group of customers that started in the same month. The reason for doing this is that churn varies over time, and using a single churn number for all customers will mask this. Cohort analysis shows:

  • How churn varies over time (the green call out below).
  • How churn rates are changing with newer cohorts, (the red call out below)  For example in the early days of your SaaS company, you may have serious product problems and lose a lot of customers in the first month. Over time your product gets better, and the first month churn rate will drop.

Cohort analysis will show this, instead of mixing all the churn rates into single number.


image


Here’s a comment on Cohort Analysis from Alastair Mitchell, CEO of Huddle: “I actually think this is more important than churn, for the simple fact that churn varies over the lifetime of a customer cohort, and just looking at monthly churn can be very misleading.  Also, given the importance of payback in a year – you really want to look at churn over the course of a 12 months cohort. For instance, in the first 3 months of a monthly paying customer you will see high churn (3 is a recurring ‘magic’ number in all of retail), then reduced churn (sometimes even positive churn) over the next 3 months less and then probably more stable spend over the next 6 months. The number you really care about is the % of customers spending after 12 months (not necessarily on a monthly basis) as that’s what matters for your CAC payback calculations.”

Two variables that really matter

As we saw above, there are two variables that have a huge effect on a SaaS business: funnel conversion rate, and churn, and it is not a bad idea to graph them as shown below.

image


Drill down into ARPU (Average Revenue per Customer)

image

ARPU is often different for different customer categories, and should be measured separately for each category. It can usually be driven up by focusing on:

  • Product Mix: adding products to the range, and using bundles, and cross-sell and up-sell
  • Scalable Pricing:  there are always some customers that are willing to pay more for your product than others. The trick is developing a multi-dimensional pricing matrix that allows you to scale pricing for larger customers that derive more value from the product. This could be pricing by the seat used (Salesforce.com), or by some other metric such as number of individuals mailed in email campaigns (Eloqua).
    If you are using scalable pricing, it will be valuable to measure what the distribution is of customers along the various axes. You could imagine taking an action to do after more seats inside of existing customers as a way to drive more revenue. etc.


Drill down into Cash


image

We already discussed Months to recover CAC as a key variable. There is another way to affect Cash: which is using longer term contracts and incenting your customers to pay for 6, 12, 24, or even 36 months up front in advance. This can mean the difference between needing to raise tons of venture capital and giving away ownership, or being able to grow the business in a self-funded manner. Given the cost of capital, you can often calculate what discount makes sense. (If capital is cheap and freely available, it doesn’t make sense to give much discount.)

If you do use longer term contracts, it will be important to measure “Discretionary Churn”. Since some of your customers are locked in and cannot churn, they could artificially lower your overall churn numbers. The way to understand what is really going on is to look at the discretionary churn, which is the churn rate for all customers that are at the point where they have the option to churn, removing those whose contracts would have prevented them from churning.

Cash Management and forecasting

Cash is one of the most important items to get right in any startup. Run out of cash, and your business will come grinding to a halt regardless of how good any of your other metrics may be. One of the most important ways to run a SaaS company is to look at CashFlow profitability (not recognized revenue profitability). What is the difference: If your business only gets paid month by month, there will be no difference, but if you get longer term contracts, and get paid in advance, you will receive more cash upfront than you can recognize as revenue, so your cash flow profitability will look better than your revenue profitability, and is a more realistic view of whether you can survive day to day on the money coming in the door.

Here is another comment from Alastair Mitchell of Huddle on this topic: “SaaS companies tuning their model should think not just in terms of the months to recover CAC, but also the topline amount of cash required to get to cashflow profitability (or the next funding round). This is probably the single biggest mistake I see in early stage companies. They don’t look ahead, using these metrics, to figure out that if the time to repay CAC is 12 months, then in aggregate they are going to need 12 months of CAC spend PLUS the number of months required of further growth to cover their operating costs (mostly engineering) BEFORE they are even cashflow positive (let alone revenue profitability). Most businesses I see fundamentally miss this and end up short; frequently through under-estimating the time to recover CAC, and churn. The readers of this blog should be focused on cashflow profitability, not revenue profitability. (Hence why your point about annual/upfront contracts is so important)”

Drill down into Growth

image

Focusing on Growth as a separate parameter can be highly valuable. It is the nature of a SaaS business to grow MRR month on month, even if you only added the same number of customers every month. However your goal should be to grow the number of new customers that you sign up every month. You can do this by focusing on:

  • Improvement in the overall funnel conversion rate
  • Lead Generation Growth
  • Growth in Funnel Capacity

The first two have been covered already. The last bullet: Growth in Funnel Capacity is an often overlooked metric that can bite you unexpectedly if you don’t pay attention to it. In my second startup, I had a situation where sales growth stalled after growing extremely rapidly for a couple of years. The problem, as it turned out, was that we had stopped hiring new sales people after reaching 20 people, a number that felt very large to me, and had maxed out on sales capacity. We started sales hiring again, and a couple of years later the business hit a $100m run rate. I witnessed a similar phenomenon at Solidworks, when after 2-3 years of phenomenal growth, their growth slowed. It turned out that their channel sales capacity had stopped growing. Solidworks started measuring and managing something that would later turn out to be a critical metric: channel capacity in terms of the number of FTE (Full Time Equivalent) sales people in their channel, and the average productivity per FTE. This has helped propel them to over $400m in annual revenues.

Another great way to grow your business is by adding new products that can be up-sold, or product features that can lead to a higher price point. Since you already have a billable contract, it is extremely easy to increase the amount being charged, and this can often be done with a touchless sale.

Other Metrics

There are a series of less important metrics that can still be useful to be aware of. I have listed some of these in the diagrams below:

image

image

After posting the above, I received a note from Gail Goodman of Constant Contact, noting that they include the cost of on-boarding a customer in CAC, not LTV as I have shown. Given that they are a public company with significant accounting scrutiny, this is likely the right way to do things.

Conclusions

If you have kept reading this long, it likely means that you are likely an executive in a SaaS company, and truly have a reason to care about this depth of analysis. I would very much like to hear from you in the comments section below to see if I have missed out on metrics that you think are important.

The main conclusion to draw from this article, is that a SaaS business can be optimized in many ways. This article aims to help you understand what the levers are, and how they can affect the key goals of Profitability, Cash, Growth, and market share. To pull those levers requires that you first measure the variables, and watch them as they change over time.

It also requires that you implement a very metrics driven culture, which can only be done from the top. The CEO needs to use these metrics in her staff meetings, and those execs need to use them with their staff, etc. Human nature is such that if you show someone a metric, they will automatically work to try to improve it. That kind of a culture will lead to true operational excellence, and hopefully great success.

David Skok is a General Partner with Matrix Partners in Waltham, Massachusetts.  This blog post was originally published on February 17, 2010.  You can find this post, as well as additional content on his blog called For Entrepreneurs.

Pages